


Key Takeaways
- Bitcoin trades at $64,549 on June 14, 2026, with 11 of 14 moving averages (MAs) registering bearish signals.
- BTC’s 1-hour and 4-hour charts show higher lows, while the MACD and momentum indicators both turn positive.
- A BTC close below $59,000 invalidates the current relief structure and opens risk toward the $50,000 zone.
Daily Chart: Corrective Structure Persists Below Long-Term Averages
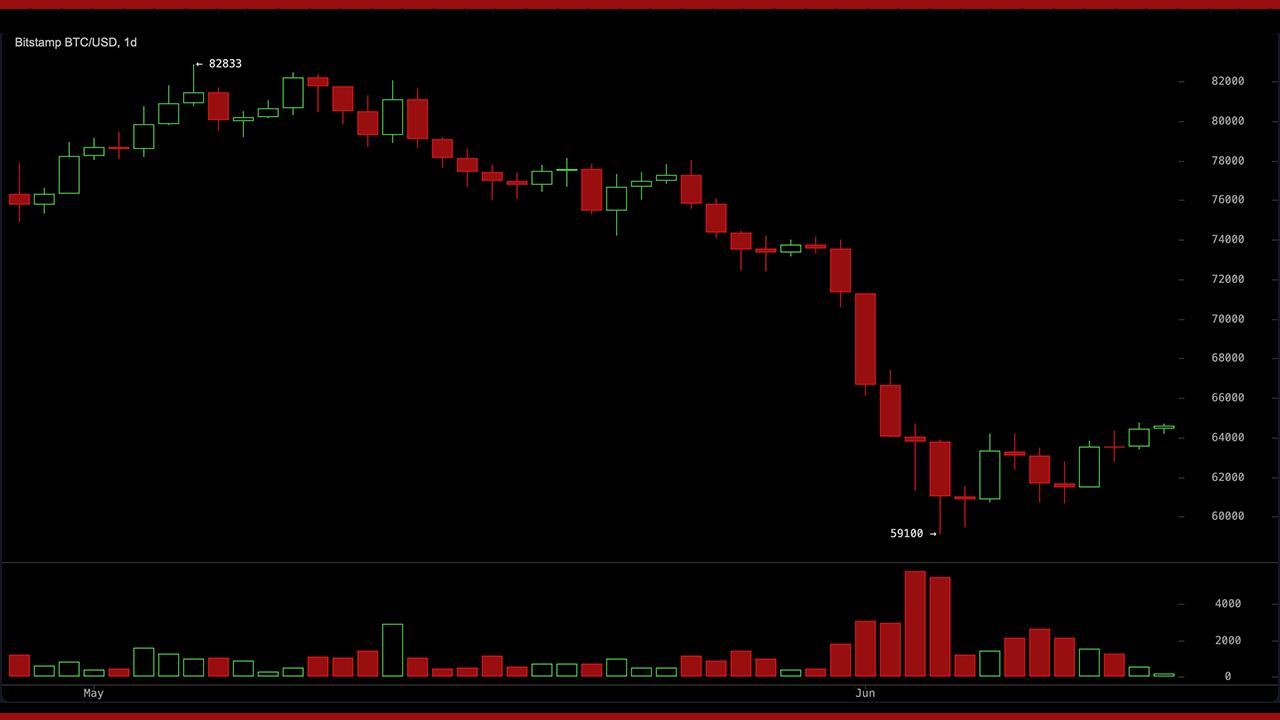
On the daily chart, bitcoin remains in a corrective phase that began after price peaked near $82,969 in early 2026 and fell to recent lows in the $59,100 to $59,215 range. Price has since rebounded into the $64,500 area and is holding near the 200-week simple moving average (SMA), a level that has historically served as a critical support floor.
The overall daily technical rating is bearish, driven primarily by price trading below the majority of longer-period moving averages. Selling pressure has eased relative to the initial drawdown, but volume remains moderate, and no confirmed trend reversal has materialized at the daily level. The $65,000 to $67,000 zone represents the first meaningful resistance band traders are watching for a potential directional signal.


4-Hour Chart: Higher Lows Point to Short-Term Stabilization
The 4-hour chart shows a more constructive setup, with bitcoin forming higher lows following the sharp selloff that drove price into the $59,000 area. That higher-low structure, combined with easing oversold conditions, suggests the aggressive downside momentum may be exhausting on this timeframe.

Price has recovered into the $62,000 to $64,000 zone, and the bias on the 4-hour chart leans neutral to slightly positive for near-term relief. Key support sits between $61,500 and $62,700, while resistance clusters between $64,000 and $65,000. Pullbacks into the $62,000 to $62,700 range with volume confirmation represent the clearest entry zone for traders positioning for a short-term bounce, with initial targets in the $64,500 to $65,500 area.
1-Hour Chart: Intraday Structure Favors Tactical Longs
The 1-hour chart carries the most positive structure of the three timeframes analyzed, with BTC attempting higher lows and showing bullish momentum attempts after earlier oversold readings cleared. Intraday support has held around $62,700, while resistance sits in the $64,500 to $65,000 zone, which aligns with current price action.

Lower-timeframe indicators, including the moving average convergence divergence ( MACD) positive signal, align with the potential for continued intraday bounces. Traders focused on tactical, shorter-duration entries are using dips to $62,700 to $63,000 as a reactive long zone, with scalp targets toward $64,800 to $65,500 and tight stops positioned below $62,500 to limit downside exposure on failed setups.
Oscillators: Neutral Consensus With Isolated Positive Signals
Seven oscillators are currently neutral on bitcoin’s daily chart, while two are issuing positive signals, and none are registering a negative reading. The relative strength index ( RSI) at period 14 reads 37, a neutral signal that places the price near but not in oversold territory. The Stochastic reads 34, also neutral. The commodity channel index (CCI) at period 20 reads negative 35, neutral.
The average directional index (ADX) at period 14 reads 45, signaling neutral trend strength. The Awesome oscillator prints negative 8,290, neutral. Momentum at period 10 reads 682 and carries a positive signal. The moving average convergence divergence ( MACD) at levels 12 and 26 reads negative 3,291 and also registers positive. The combined oscillator summary is neutral overall: zero negative signals, nine neutral readings, and two positive.
Moving Averages: Bearish Pressure Dominates Longer Periods
Moving average (MA) data paints a bearish structural picture across longer timeframes, with 11 of 14 tracked averages registering negative signals. The 10-period exponential moving average (EMA) sits at 64,200 and signals bullish, as does the 10-period simple moving average (SMA) at 62,742. From the 20-period level out, every tracked moving average signals bearish. The 20-period EMA sits at 66,624, the 20-period SMA at 66,882, the 30-period EMA at 68,633, and the 30-period SMA at 70,274.
Longer averages extend the gap further: the 50-period EMA reads 70,810, the 50-period SMA reads 73,901, the 100-period EMA sits at 73,412, the 100-period SMA at 72,626, the 200-period EMA at 78,792, and the 200-period SMA at 77,643. Bitcoin trading below each of those levels confirms the bearish moving average structure on the daily timeframe. A decisive close above $65,000 to $67,000 would begin closing that gap against the nearest negatively signaling averages.
Bull Verdict:
Bitcoin’s 1-hour and 4-hour charts are holding higher lows, the moving average convergence divergence ( MACD) and momentum indicator are both positive, and price is sitting on the 200-week simple moving average (SMA), a level that has historically absorbed heavy selling pressure. If buyers defend the $62,000 to $63,000 support zone and volume picks up, a push toward $65,000 to $67,000 is the next logical target. The oscillator panel carries zero negative readings, which means downside confirmation is absent at this stage.
Bear Verdict:
Eleven of 14 moving averages are negative, price remains well below the 200-period exponential moving average (EMA) at $78,792, and the daily chart has not produced a confirmed trend reversal. The rebound from $59,100 looks corrective rather than impulsive, and the $64,500 to $65,000 resistance zone has not been cleared with conviction. A failure to hold $62,000 reopens the path toward the $59,000 to $61,000 demand area, and a daily close below $59,000 puts the $50,000 zone back on the table.


