


Welcome to the 20th UK Property Market Stats Show of 2025, your go to weekly ‘TV show’ on the UK property market on YouTube.
This week, I’m joined by Iain McKenzie, as we delve into the key property market headlines for 20th week of 2025 ending on the 25th May 2025.

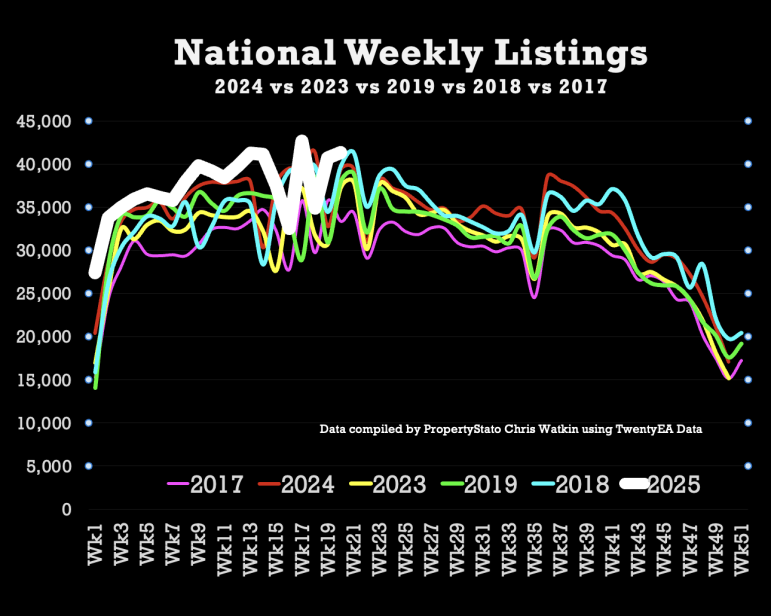
✅ Listings (new properties on the Market)
41.3k new listings this week (last week 40.6k)
YTD 6% higher than week 20 of 2024 YTD and 9% higher YTD compared to 2017/18/19. 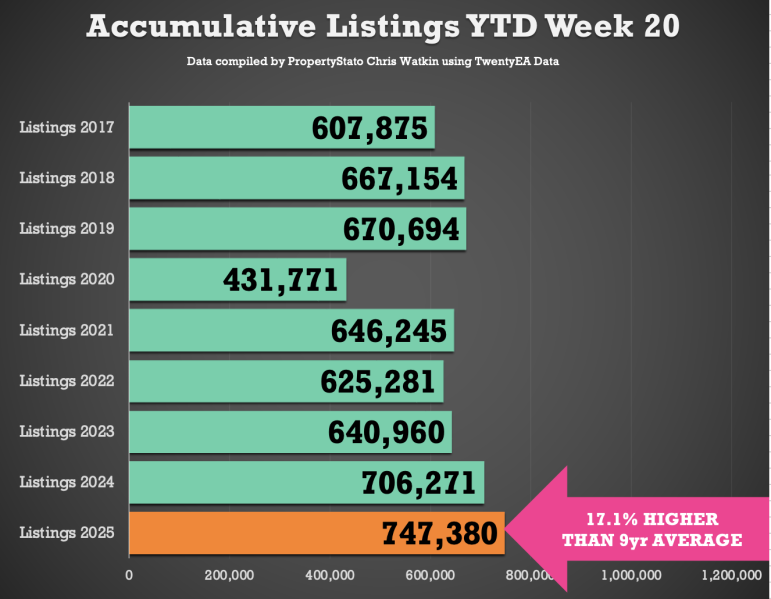


✅ Price Reductions (% of Resi Stock)
27.2k price reductions this week – monthly run rate in reductions – 1 in 7.5 of resi sales stock per month is being reduced (which represents 13.4%).
For comparison, 12.1% average in 2024, though the long-term five-year average is 10.6%. 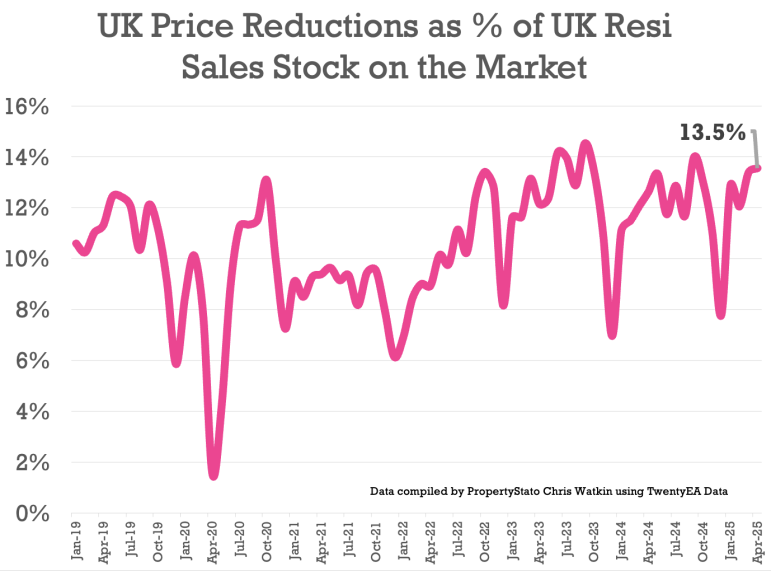

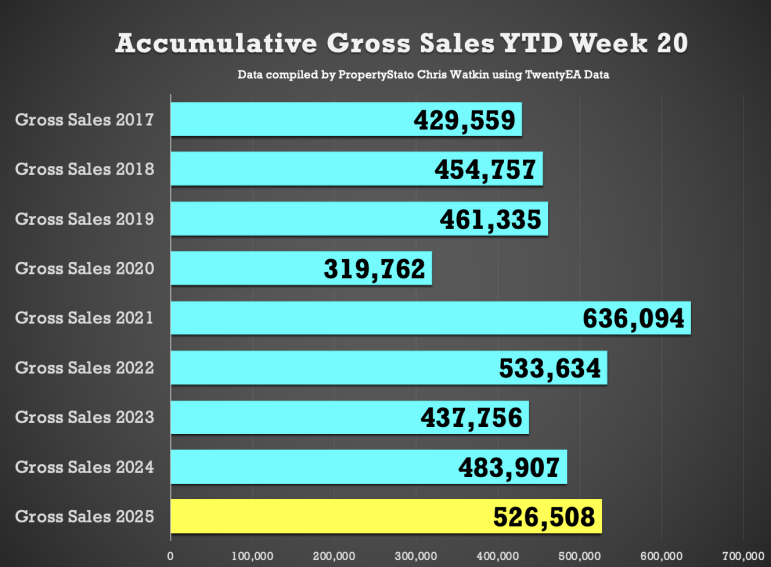
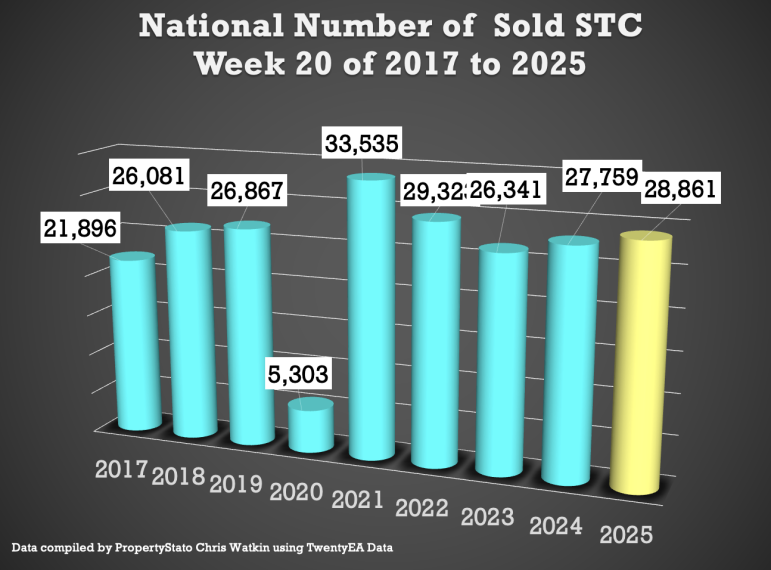
✅ Total Gross Sales (agreed sales)
28.9k UK homes sold STC this week (last week 28.8k). The best week for resi sales since May 2022.
YTD – The number of sold STC Resi homes are 9% higher compared to 2024 (527k sales agreed YTD 2025 vs 484k YTD 2024) and 17% higher than 2017/18/19 YTD levels (399k). 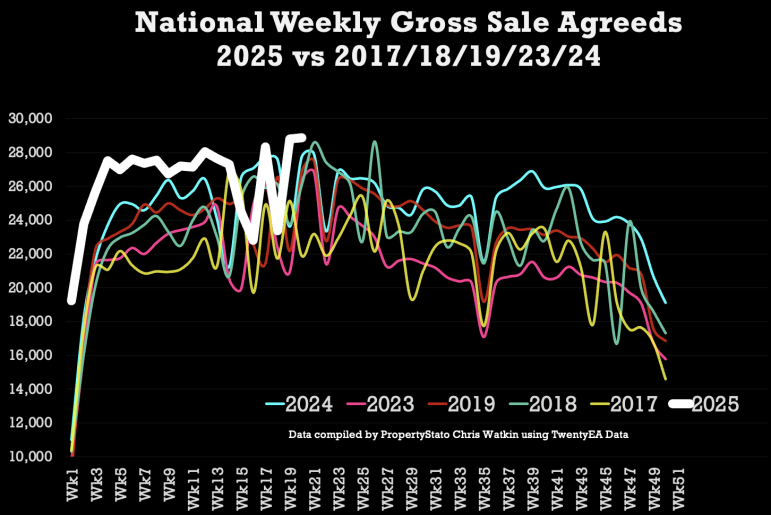


✅ Sell-Through Rate (monthly in arrears)
April’s sale run rate of 15.36% of resi stock sold stc (ie 15.36% of estate agents properties on the market went sale agreed). March’s was 16.3%. 2024 monthly average: 15.3%. Long-term eight-year average: 17.9%. 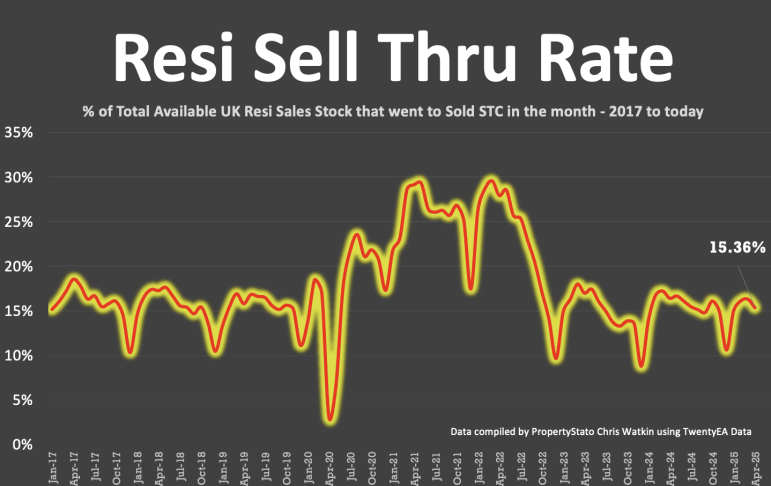

✅ Sale Fall-Throughs
6,618 sale fall-throughs last week from resi sale sales pipeline of 453k UK homes sale agreed (sold STC).
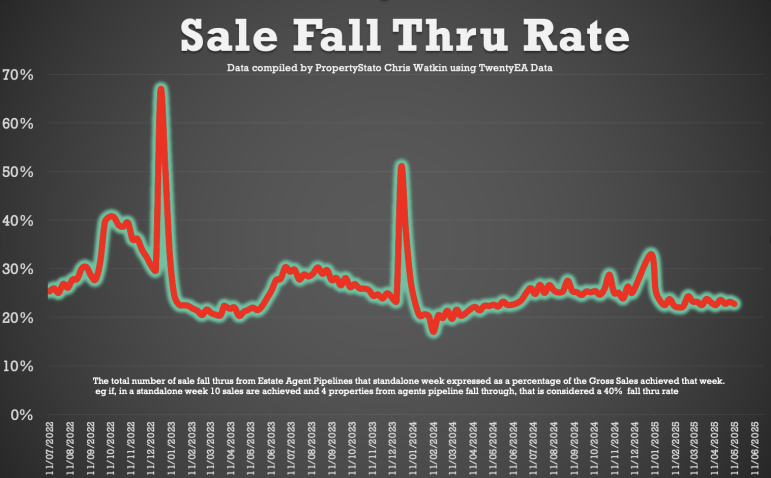
Another method is that week’s sale fall throughs as a percentage of gross sales that week. This week, that is 22.9% (last week 22.7%). That is below the seven-year average of 24.2%, and well below the 40%+ levels post-Truss Budget (Autumn 2022).
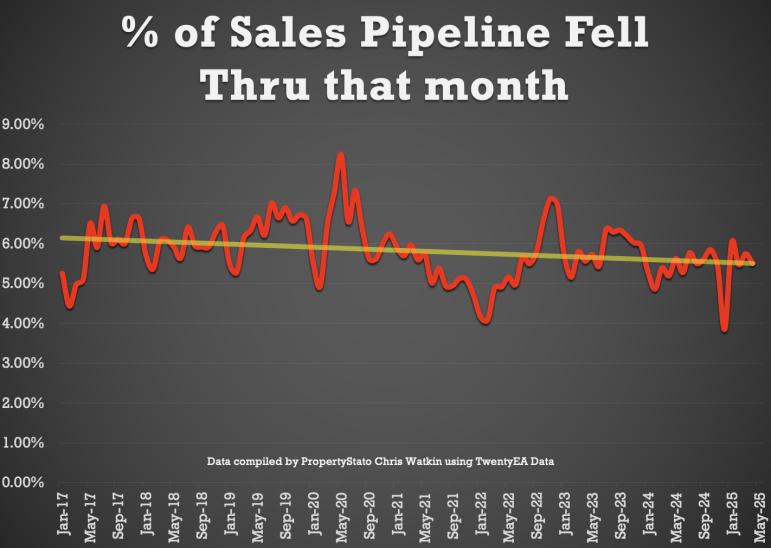
In April, as a whole, 5.51% of sales in the UK agents pipelines fell through. For comparison, 2024 average: 5.36%. 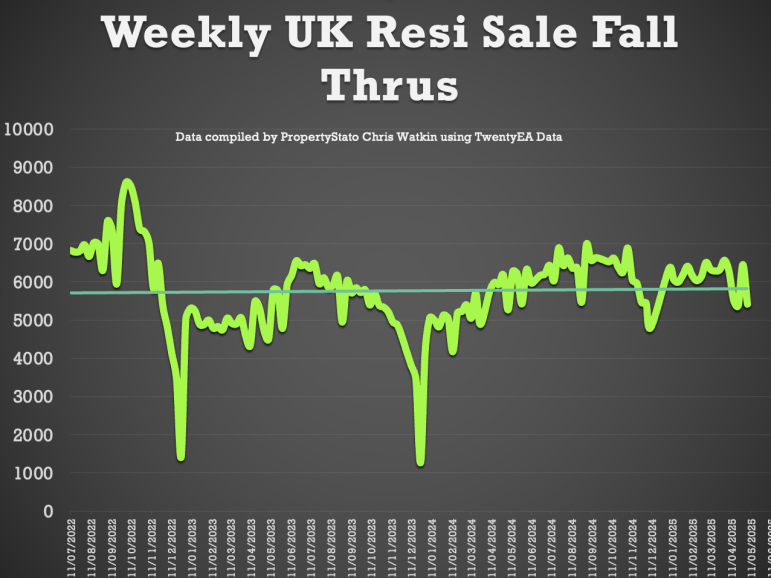


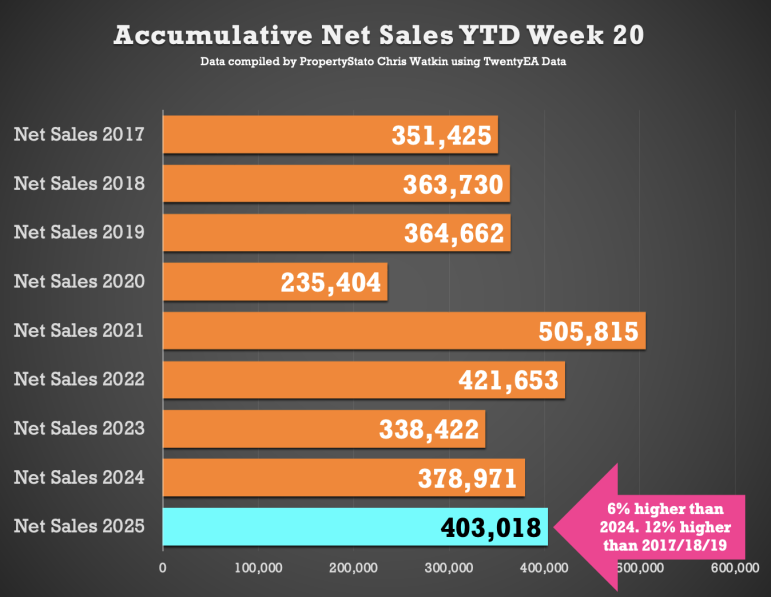
✅ Net Sales (gross sales for the week less sale fall throughs for the week)
22.2k net sales this week (22.2k last week), compared 2025 weekly average of 20k.
2025 YTD is 6% higher than compared to 2024 YTD and 11.5% higher than YTD 2017/18/19. 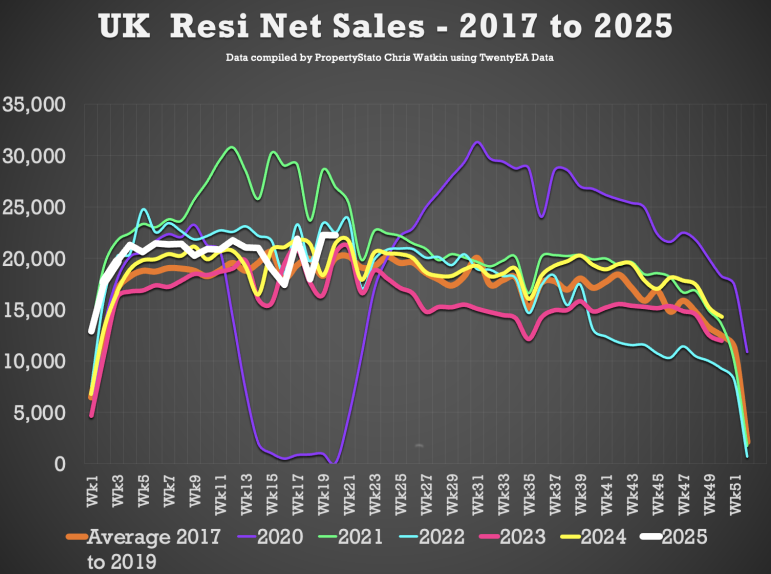


Local Focus this week
Canterbury


