


This week I am joined by Kristian Stott as we delve into the key property market headlines for 15th week of 2025 ending on the 20th April 2025.

Listings (New Properties on the Market)
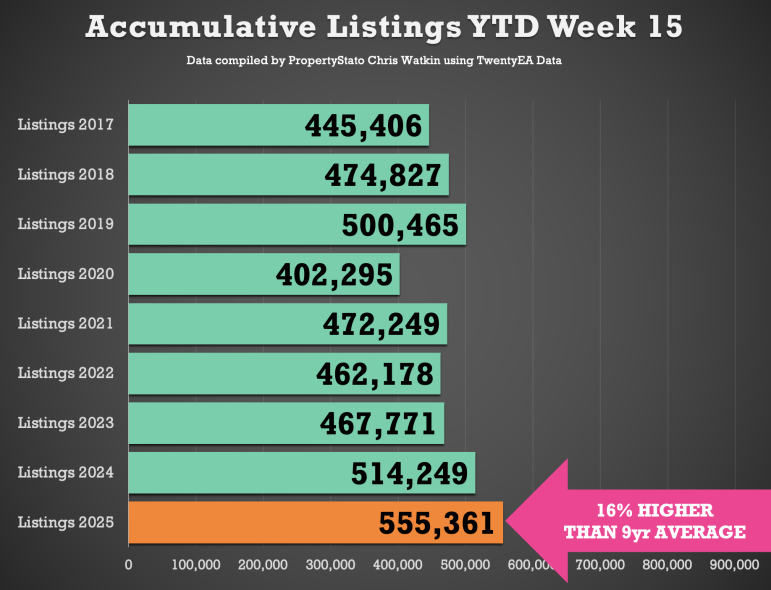
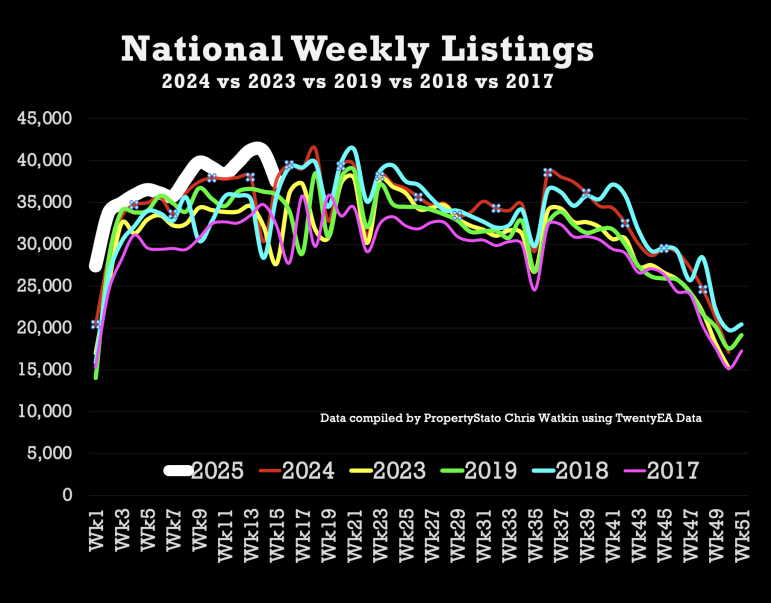
37.5k new listings this week (last week 41.1k)
That’s 8% higher than Week 15 of 2024 YTD and 9% higher YTD compared to 2017/18/19.


✅ Price Reductions (% of Resi Stock)
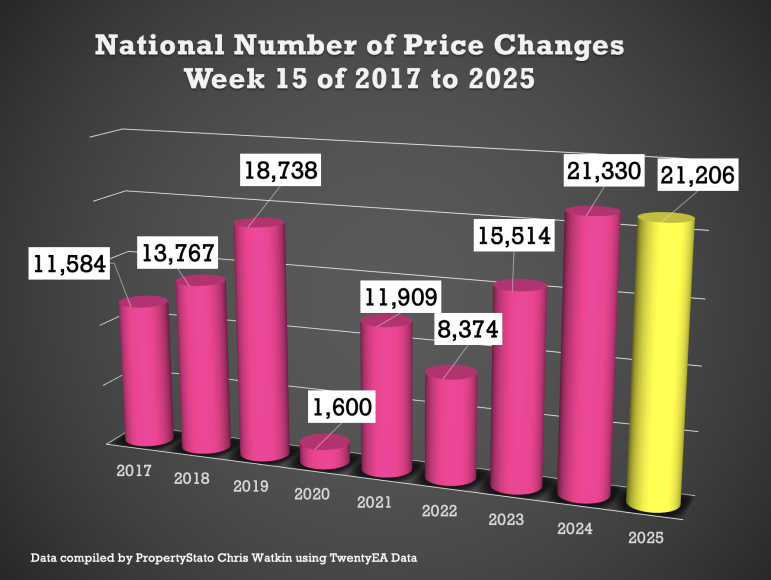
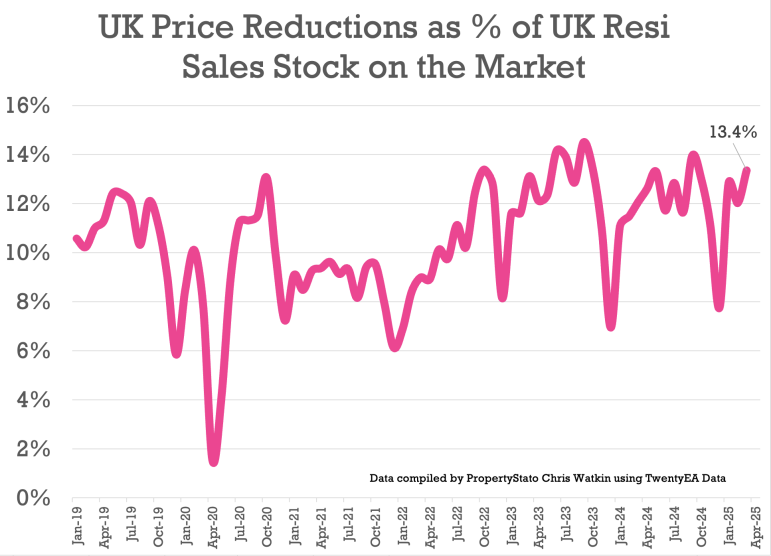
21.2k Price Reductions this week – Monthly Run Rate in reductions – 1 in 7.5 of Resi Sales stock per month is being reduced (which represents 13.4%).
For comparison, 12.1% average in 2024, though the long-term 5-year average is 10.6%.


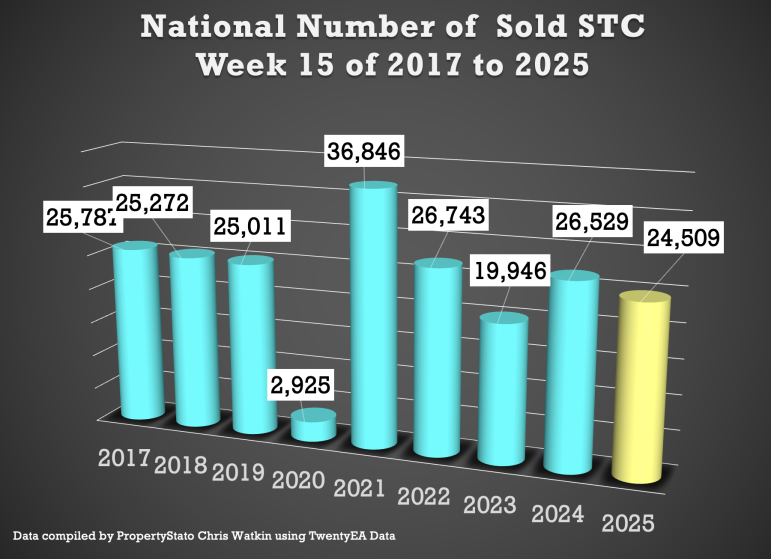
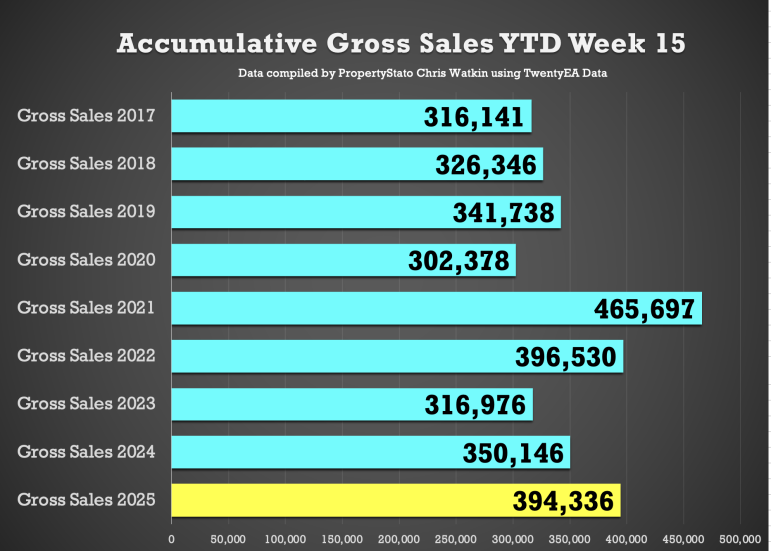
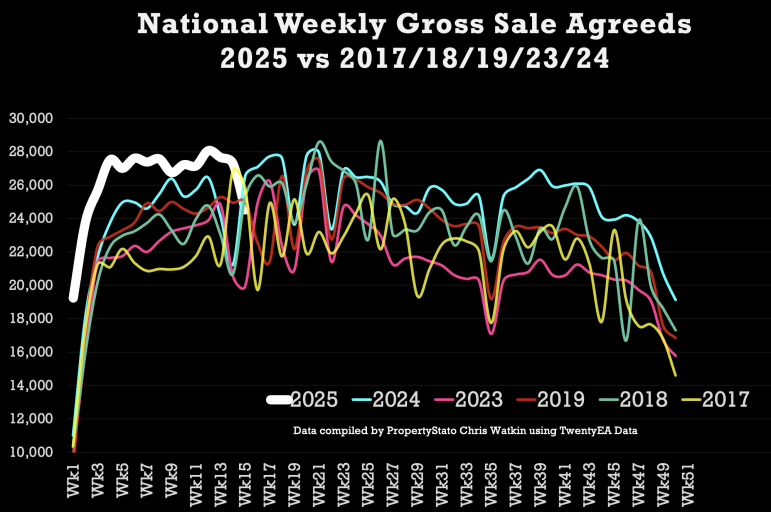
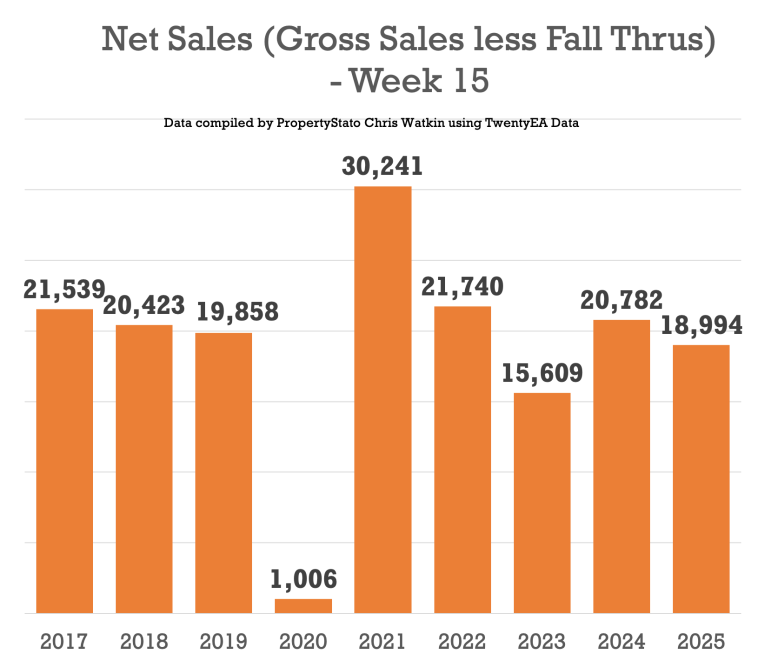
✅ Total Gross Sales (Agreed Sales)
24.5k UK homes sold STC this week, down slightly because of Easter Weekend
YTD – The number of Sold STC Resi homes are 13% higher compared to 2024 (394k YTD 2025 vs 350k YTD 2024) and 20% higher than 2017/18/19 YTD levels (328k).


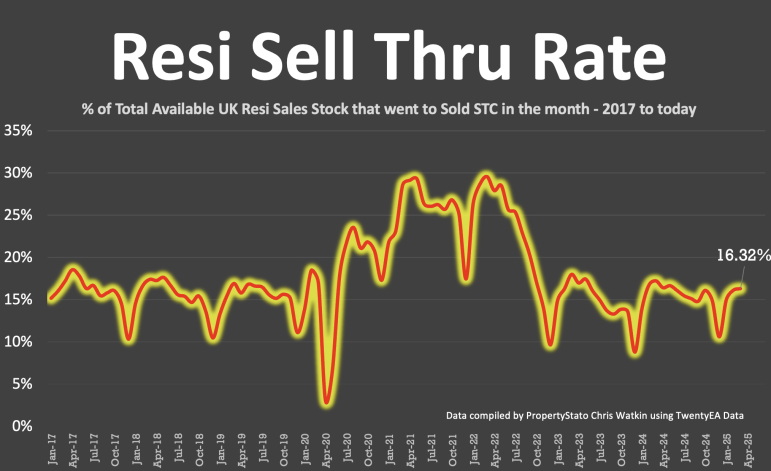
✅ Sell-Through Rate (Monthly in Arrears)
March’s sale run rate of 16.3% of Resi stock sold stc (ie 16.3% of Estate Agents properties on the market went sale agreed). 2024 monthly average: 15.3%. Long-term 8-year average: 17.9%.

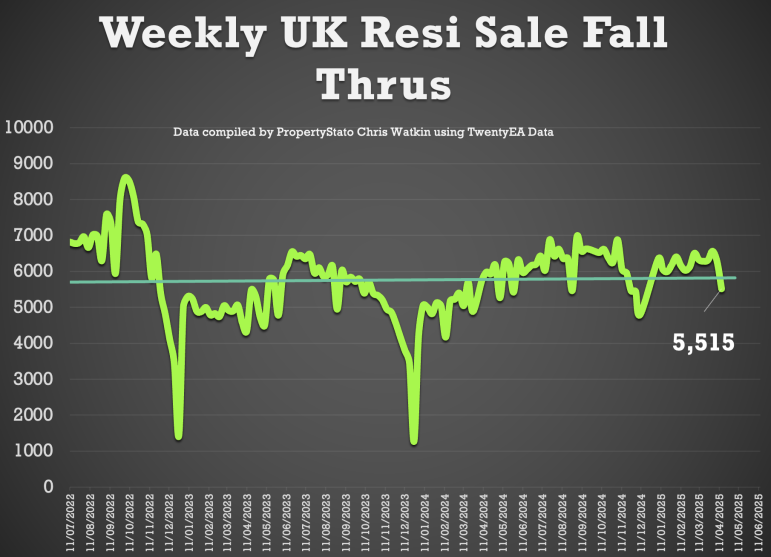
✅ Sale Fall-Throughs
5,515 Sale fall-thrus last week from Resi Sale Sales Pipeline of 467,414 homes sale agreed (sold stc).
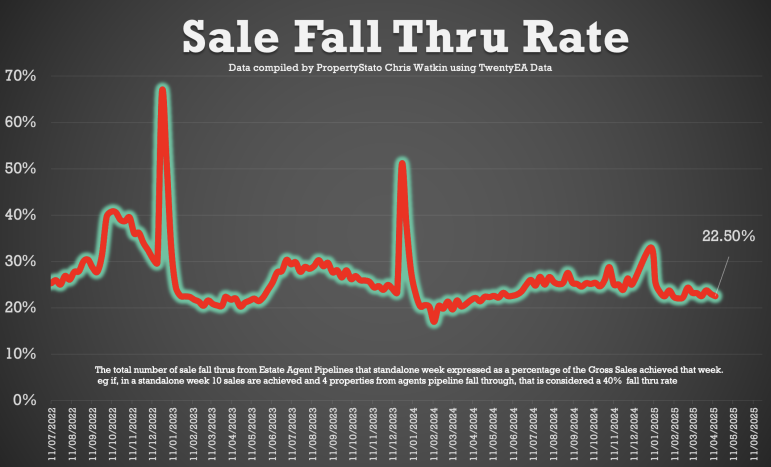
Another method is that week’s sale fall thrus as a % of gross sales that week. This week, that is 23% (last week 23.7%). Just above the 7-year average of 24.2%, yet well below the 40%+ levels post-Truss Budget (Autumn 2022).
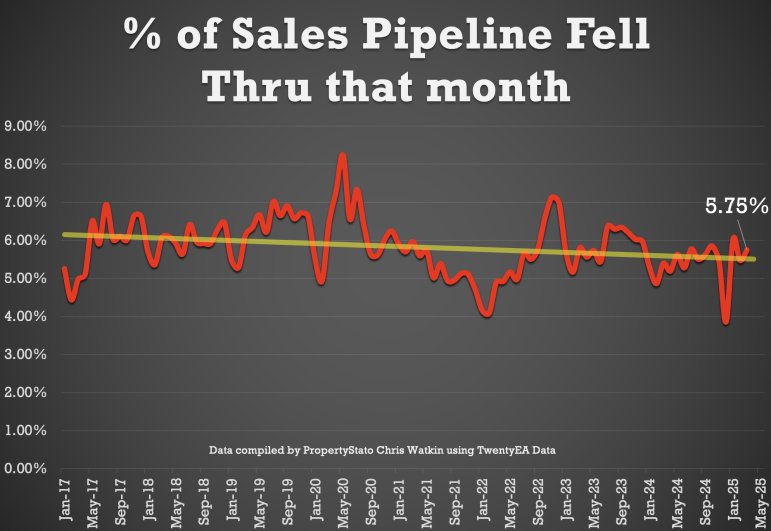
Last month, as a whole, 5.75% of sales in the UK agents pipelines fell thru. For comparison, 2024 average: 5.36%.


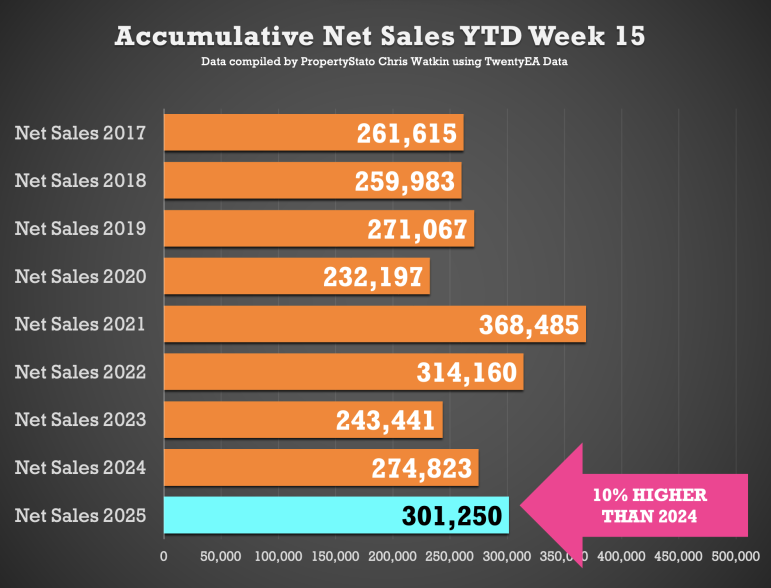
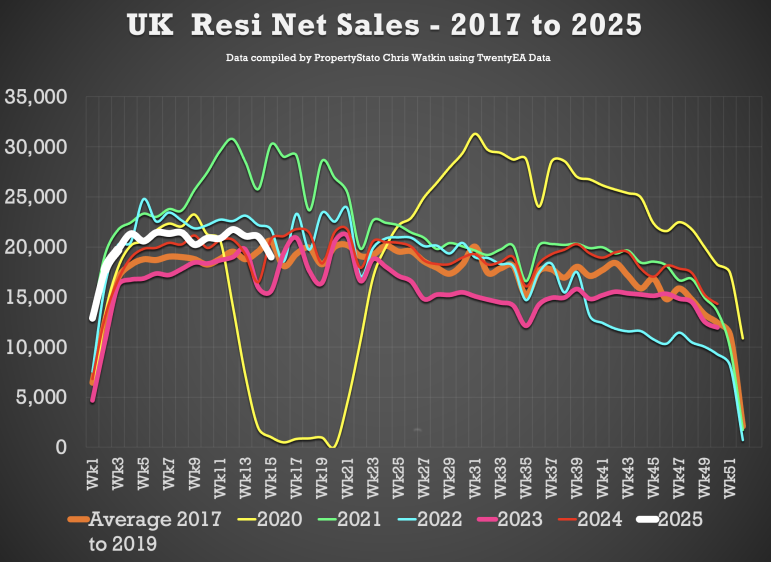
✅ Net Sales (Gross sales for the week less Sale Fall Thrus for the week)
19k net sales this week (21k last week), compared 2025 weekly average of 20.1k. (remember its Easter)
2025 YTD is 10% higher than compared to 2024 YTD and 14% higher than YTD 2017/18/19.


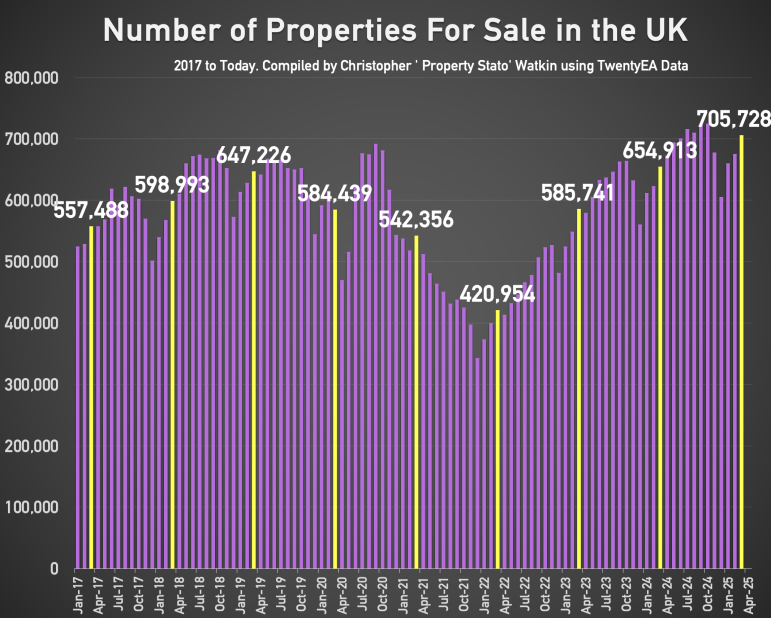
✅ Residential Sales Stock on the Market
705k properties on the market on the 1st April 2025 (monthly stat taken on the first day of the month).
Historical comparison for 1st April :
- 2024: 654k
- 2023: 585k
- 2022: 421k
- 2021: 542k
- 2020: 584k
- 2019: 647k
- 2018: 598k
- 2017: 557k.

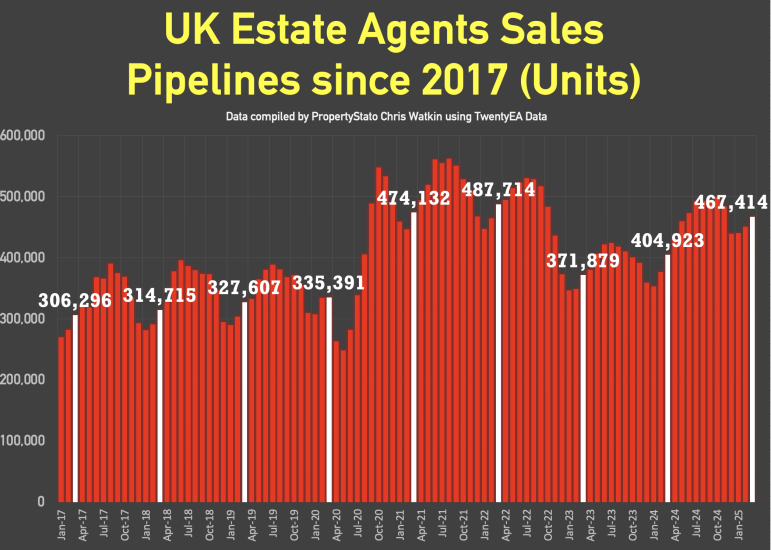
✅ Residential Sales Sold STC Pipeline
467k sales agreed in Estate Agents Sales Pipeline (ie sold stc but not yet completed) as at the 1st April 2025 (monthly figure)
Historical comparison for 1st April :
- 2024: 404k
- 2023: 371k
- 2022: 487k
- 2021: 474k
- 2020: 335k
- 2019: 337k
- 2018: 314k
- 2017: 306k.
✅ UK House Prices (£/sq.ft)
As always, the £/sq.ft metric predicts Land Registry figures 5 months in advance with 92% accuracy (the orange line of the graph).
March’s final figure: £343/sq.ft.
- December ’24 : £335/sq.ft
- March ’24 : £337/sq.ft
- March ’23: £333/sq.ft
- March ’19: £270/sq.ft
This means UK house prices achieved on the sales agreed in March 25 were 2.36% higher than Dec 24, and 1.63% higher than a year ago (March 24).
Local Focus this week –
Norwich estate & letting agents
What is currently happening in the UK property market?


