


LonRes data for March indicated an annual decrease of 34.2% in lets agreed and a 23.5% decrease in new instructions, with activity on both measures remaining well below pre-pandemic levels.
Table 1 – Monthly Prime Data – March
| Prime Sales | Prime Lettings | |||
| Annual
Change |
Change vs. 2017-19 (pre-pandemic) | Annual
Change |
Change vs. 2017-19 (pre-pandemic) | |
| Achieved prices/rents | -2.7% | -3.6% | 4.9% | 33.3% |
| Properties sold/let | 29.9% | 32.4% | -34.2% | -68.5% |
| New instructions | 14.6% | 29.8% | -23.5% | -63.5% |
Source: LonRes
The stock of available rental properties decreased on an annual basis, with 16.0% fewer homes on the market across prime London at the end of March than a year earlier. As noted previously these measured activity levels may overstate the true falls as fewer rental properties are being advertised, be that on LonRes or other sources including public facing portals.
Annual rental growth in March was 4.9%, down from a revised 6.2% in February but still part of a wider trend of rises over the past year. Rents across prime London are now 33.3% above their 2017-2019 (pre-pandemic) average.
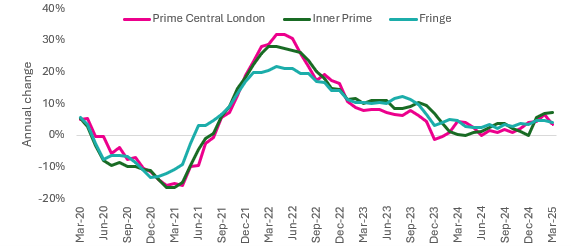
Broken down by sub-market, rental growth is in general behaving similarly across our core catchments, but inner prime has been the best performer in 2025 so far. Covering neighbourhoods such as Notting Hill and Marylebone, annual rental growth in inner prime in March was 7.3%, the highest in this area since November 2023. All areas are recording higher growth compared to 2024, but well down on the levels of 20+% seen in early 2022.
Annual Rental Growth by Area

Source: LonRes
Nick Gregori, head of research, LonRes said: “Unlike the volatility seen in the sales market, prime London lettings has been consistent so far in 2025. Low levels of new instructions are limiting activity, with the usual caveat that many deals are taking place without the properties being marketed. Annual rental growth was 4.9% in March, with our inner prime catchment recording the largest rise this year.”
As far as the prime London sales market is concerned, there are some positive signs that market activity is improving on both last March and the longer-term average for the time of year. After February’s surprise rise, average achieved prices fell again on an annual basis.
There were 29.9% more transactions in March than the same month a year ago, and 32.4% than the 2017-2019 (pre-pandemic average) March average. The number of properties going under offer was 6.9% higher than a year ago, and 17.3% more than the 2017-2019 (pre-pandemic average) March average.
On the supply side, new instructions increased by 14.6% in March compared to the same month last year and were 29.8% above the 2017-2019 March average. There was further growth in the number of price reductions, with 77.6% more than a year earlier. Stock on the market across prime London continued to grow; it was 9.1% higher at the end of March than a year earlier.
So far this year the market has been mixed, impacted by political and economic volatility and the ending of the stamp duty holiday on 31 March. This has fed into some ups and downs in the monthly data. Looking at the whole first quarter smooths out some of the month-to-month noise and shows a market that appears relatively balanced.
Over Q1 2025 stock levels were higher, with new instructions up 20.3% in March compared to the same period last year and 35.6% above the 2017-2019 Q1 average. Similarly, sales were up 12.4% annually and 20.5% compared to the longer-term average, but clearly the market remains price sensitive given the 57.7% annual rise in price reductions.
The high level of price reductions are borne out by a fall in average achieved prices, which fell by 2.7% across prime London in March. Compared to pre-pandemic (2017 to 2019) average levels, prices in March were 3.6% lower (table 1). The average discount from initial asking price across prime London was 8.2% in March.
As one might expect, the longer a home is on the market the bigger the discount to asking price needed to secure a sale. In Q1 this year, the average discount for homes selling in under three months was just 3.1%, while the discount for those taking between six and 12 months was 9.7%.
Last year the pattern was similar but with slightly higher discounts across the board. Even in the stronger market of Q1 2022 those properties on the market the longest were achieving less than 90% of their initial asking price. The analysis suggests that getting the pricing right at the start of the process is key to quicker sales, whatever the market conditions.
Meanwhile, the £5m+ market continued its mixed start to the year with a slow March. Transactions were 17.1% lower than in the same month last year, but 4.8% above the 2017 to 2019 March average. For Q1 as a whole, sales were down 13.3% compared to last year but 25.1% up on the 2017 to 2019 Q1 average.
Supply continued to rise, with new £5m+ instructions in March 61.8% higher than last year. The quarterly data puts into context how large the supply growth in this market has been – new instructions in Q1 this year were more than double the pre-pandemic (2017 to 2019) Q1 average. The number of £5m+ homes on the market has risen by 22.2% in the 12 months to the end of March. Price reductions have significantly increased in volume too – by 69.0% on an annual basis in Q1 – meaning more choice for buyers.
Nick Gregori, head of research, LonRes said: “Across prime London sales activity looked much more positive in March, with transactions growing strongly compared to the same month last year. After February’s surprise house price rise, average achieved values fell again on an annual basis, suggesting perhaps that increasingly realistic pricing may have been the key to unlocking more demand. After many months where the flow of under offers into exchanges has not been smooth, this pick up in deals going through is a welcome result for buyers, sellers and agents.
“As always with a single good month or even quarter, it will take longer to know if this is a sustainable increase in activity or a temporary one. There is an argument in favour of the latter given that the ending of the stamp duty holiday on 31 March is likely to have created pressure to conclude deals and secure a tax saving, however small. From April we may see a return to less decisive buying activity without this incentive.
“The top end of the market did not see the same kind of improvement. At £5m+ the relative scale of the potential tax saving is much smaller so the change to SDLT is likely to have had a minimal impact. With so much political and economic uncertainty around, demand is likely to remain subdued as potential buyers revisit the now well-worn phrase ‘wait and see’.
“The outlook for mortgage rates is often a key consideration for buyers, but the extent of expected rate cuts this year are now subject to growing and unpredictable external risks. Economists are forecasting higher chances of recession in many countries as a consequence of the stop-start trade war initiated in the US. Struggling economies both at home and from countries which international buyers are drawn are unlikely to be a good thing for the prime London market.”


